Power BI and Tableau Samples
You can download the PDF of the Power BI samples from Oct Data on My Github Page
Power BI – Visuals:
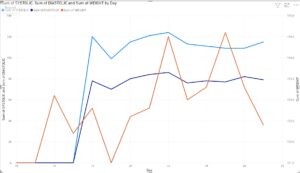
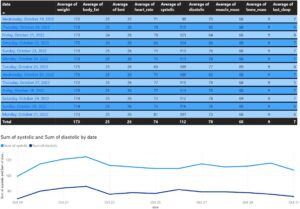
Power BI – Blood Pressure and Weight Line Chart
Sum of Blood Pressure and Weight by Day (BP did not start getting recorded until 10-18-2022.)
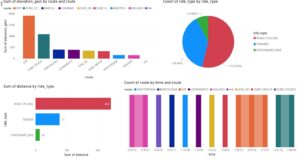
Power BI – Rides and Routes
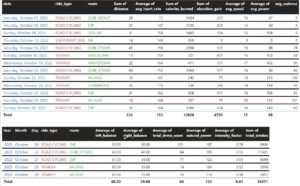
Power BI – Rides and Vitals – Sums and Averages
I extracted the data from MS SQL Server 2019.
_________________________________________________________________________________
To see more of my public Vizzes, please visit: My Tableau Public Profile
Tableau Vizzes:
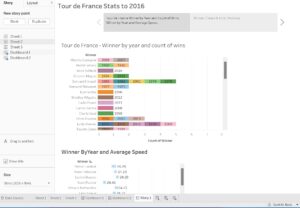
Viz 1 – Tour de France:
Dashboard 1 = Winner by year and count of wins.
Dashboard 2 = Winner and Team by year and distance.
_______________________________________________________________________________________________________________________________________________
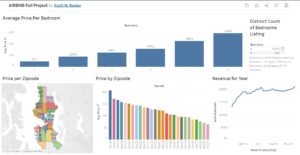
Viz 2 – Seattle AirBNB Stats:
Charts =
Average Price Per Bedroom
Distinct Count of Bedrooms Listing
Price per Zipcode
Price by Zipcode
Revenue for Year
_______________________________________________________________________________________________________________________________________________
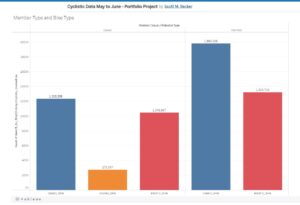
Viz 3 – Cyclistic Data:
Member Type and Ridable Type
There were significantly more Members rides with classic bikes then Casual Riders. However, among Casual Riders the distribution of classic bike rides and electric bike rides were closer than the Members. The overall electric bike rides were closer in numbers between Members and Casual riders, although Members still had more rides than Causal Riders.
_______________________________________________________________________________________________________________________________________________
To hire me click HERE
MY BRANDS:
To learn more about the Freelance Data Analyst and Cloud Engineering work I do, please visit XL Mobile Media
To learn more about the Digital Marketing and Analytics work I do, please visit XL Digital Media
