Excel Pivot Tables and Charts
You can download the Excel spreadsheet from /Oct Data on My Github Page
The spreadsheet contains tabs for Oct Vitals, Oct Rides, Oct Power Meter, along with the Oct Pivot Tables and Oct charts. (Note – It is too large of a file to preview on Github, due to formatting.)
Oct. Excel Pivot Tables and Charts
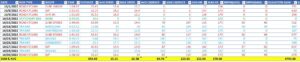
A sample of Oct. Rides color coded by Ride type.
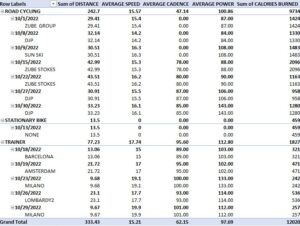
Pivot Table 1 = Summary of Oct. ride data showing sums of total distance, calories burned & averages of speed, cadence and power broken down by route and date.
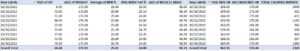
Pivot Table 2 = Combination of 2 pivot tables broken down by date, showing average heart rate, weight, BMI&, body fat %, muscle mass (lbs) before rides, and average heart rate, max heart rate and total calories burned during rides for the corresponding dates.
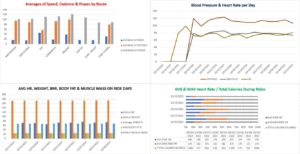
Chart 1 = bar chart showing averages of speed, cadence & power broken down by route.
Chart 2 = line chart showing blood pressure, & heart rate by date. (Note – data did not start getting collected on all of these until 10/14/2022.)
Chart 3 = average heart rate, weight, body fat& and muscle mass (lbs) on ride days. (Note – not all ride days had complete vitals.)
Chart 4 = average and max heart rate with total calories burned during rides.
To hire me click HERE
MY BRANDS:
To learn more about the Freelance Data Analyst and Cloud Engineering work I do, please visit XL Mobile Media
To learn more about the Digital Marketing and Analytics work I do, please visit XL Digital Media
